
- Bitcoin seen nursing some minor losses on Monday of around 0.5%, cooling seen across the market for now.
- BTC/USD in yesterday’s session saw a rejection at an attempted breakout from the rising channel.
- Big bearish wick seen on the candle that failed to break above resistance.
BTC/USD 4-hour chart
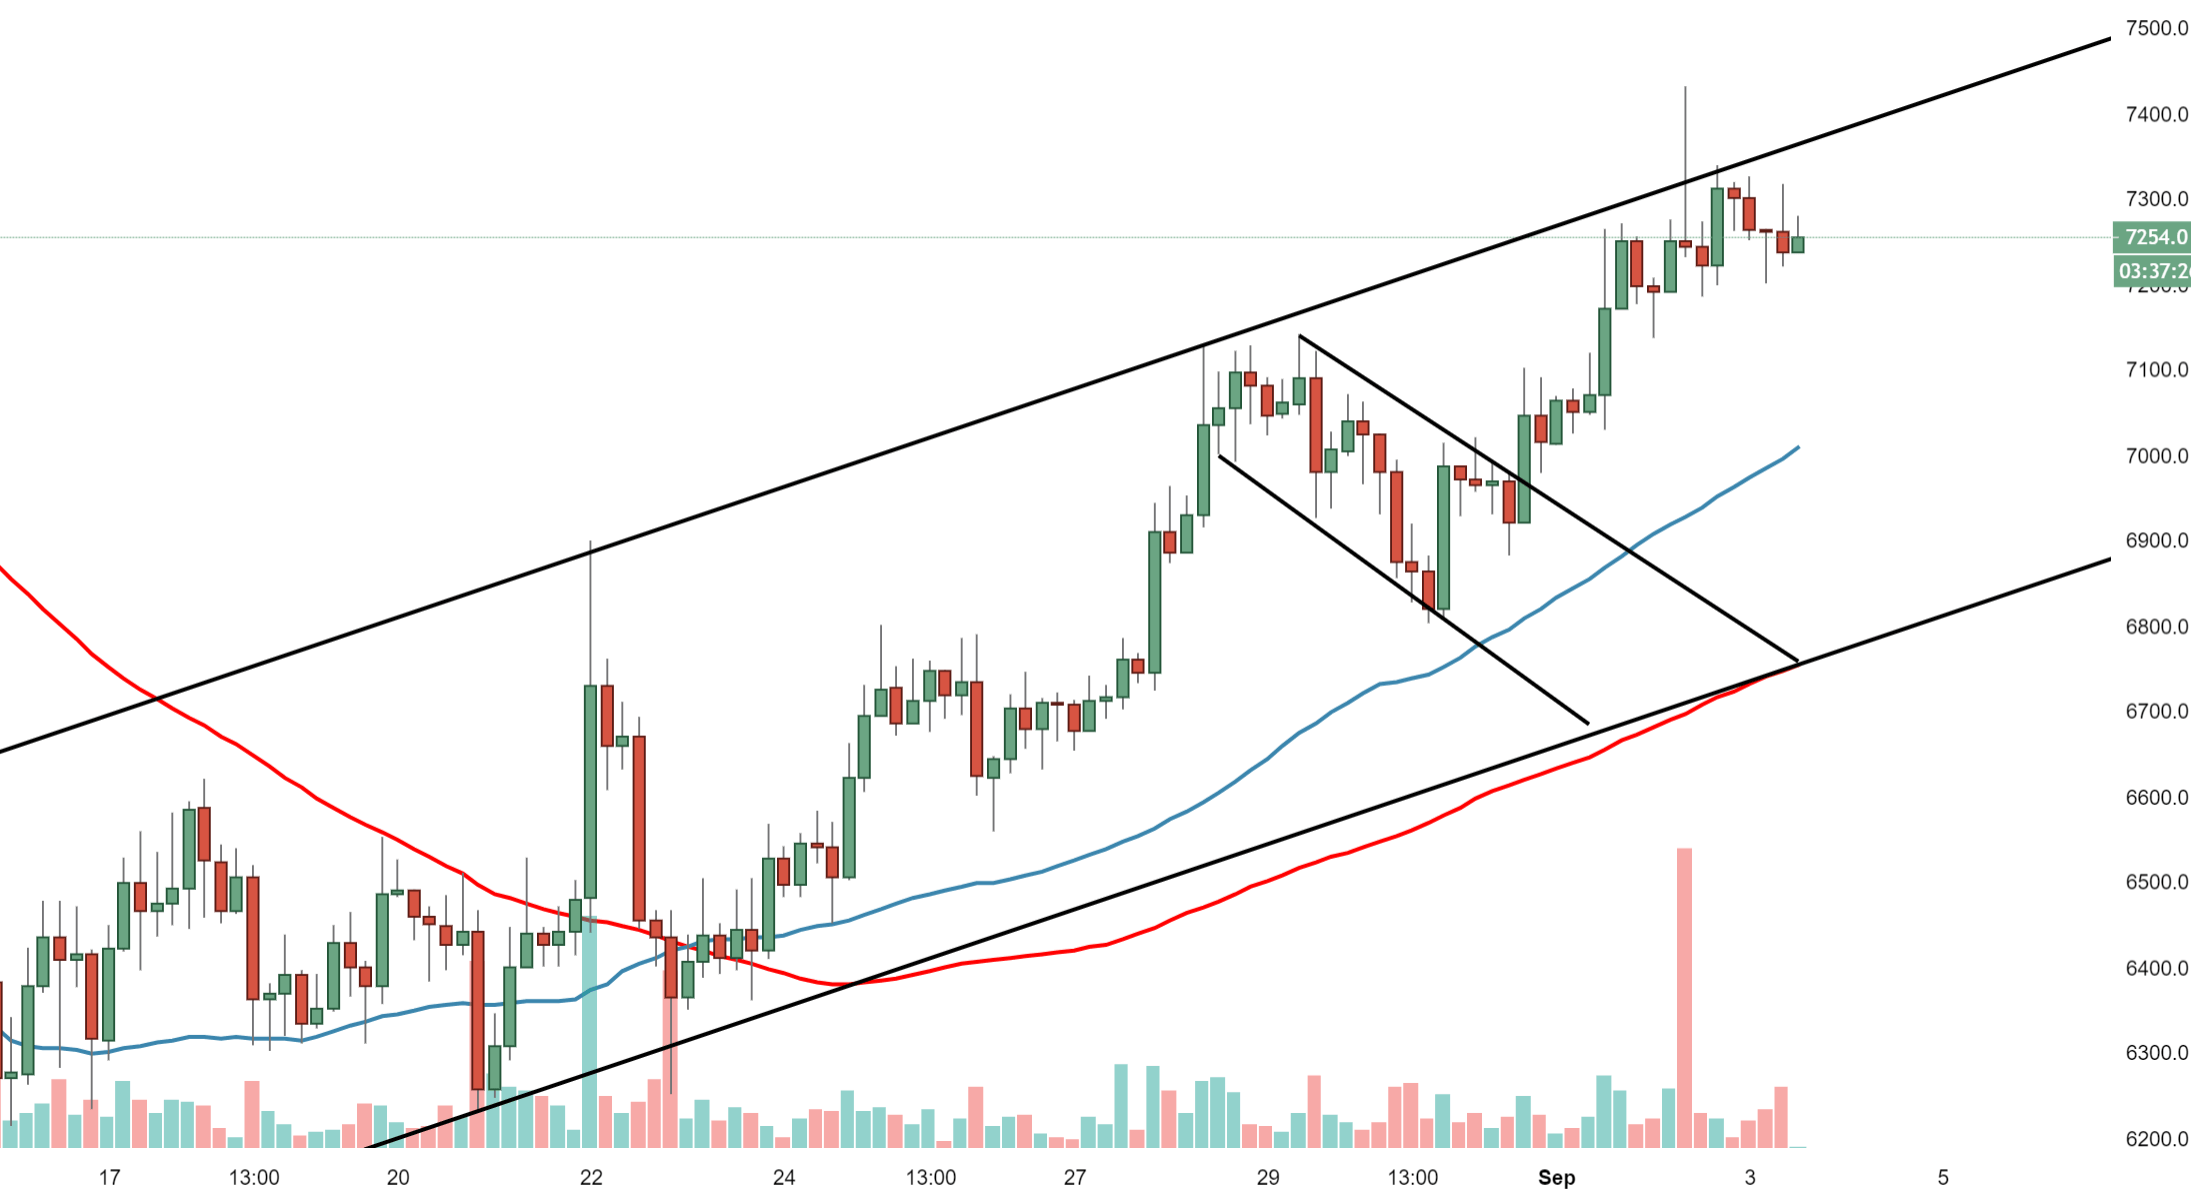
Spot rate: 7265.0
Relative change: -0.50%
High: 7324.8
Low: 7200.0
Trend: Bearish
Support 1: 7200.0, support on 4-hour chart.
Support 2: 7122.5, top area on 28th August.
Support 3: 7010.0, 50DMA.
Resistance 1: 7325.0. resistance on 4-hour chart.
Resistance 2: 7377.0, upper part of rising channel.
Information on these pages contains forward-looking statements that involve risks and uncertainties. Markets and instruments profiled on this page are for informational purposes only and should not in any way come across as a recommendation to buy or sell in these securities. You should do your own thorough research before making any investment decisions. It also does not guarantee that this information is of a timely nature. Investing in Forex involves a great deal of risk, including the loss of all or a portion of your investment, as well as emotional distress. All risks, losses and costs associated with investing, including total loss of principal, are your responsibility.