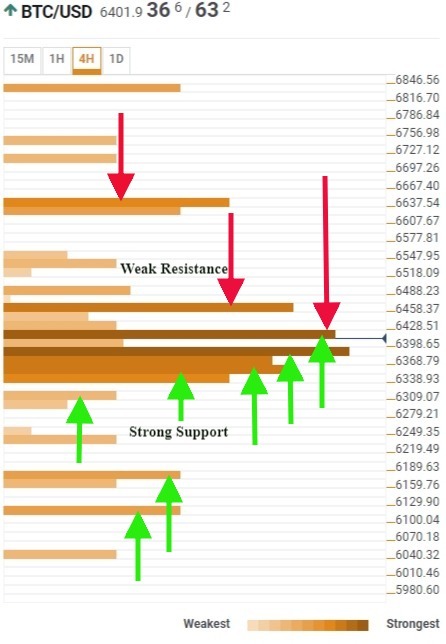
- In the short term, the BTC/USD rests in a support zone that extends to the $6,330 price level.
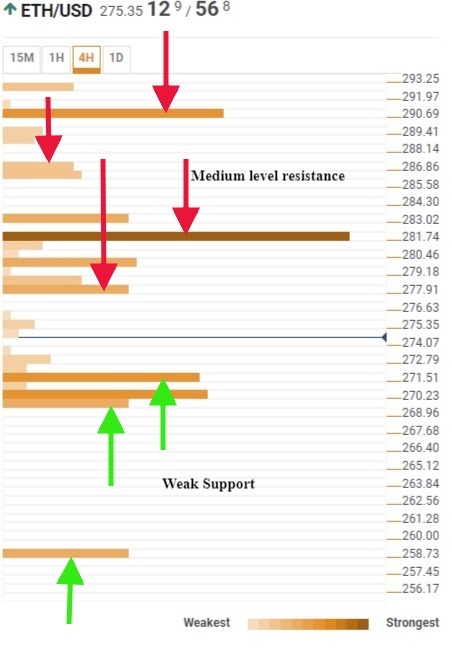
- Ethereum, on the other hand, is in a neutral zone, with support at the $270 price level.
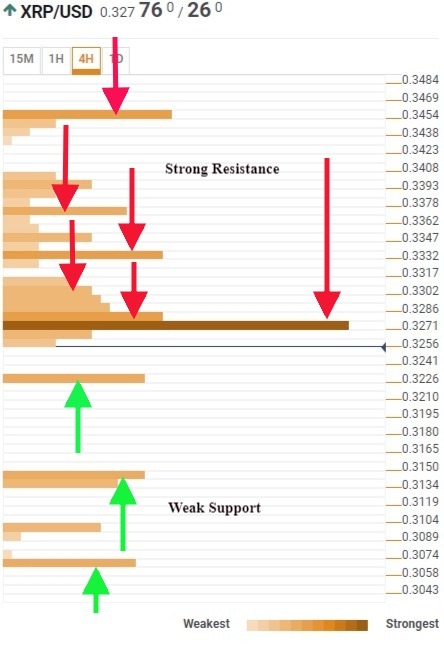
- The XRP/USD is just below the strongest resistance level at the $0.370 price level.
A few changes from yesterday’s analysis. The market is awaiting the opinion on the products linked to derivatives on Bitcoin proposed by the capital management company ProShares.
BTC/USD 240 Min
Above the current price, the BTC/USD has little opposition if it ever decides to move higher. First and just above the current spot price, at the $6400 price level, we see the 61.8% daily Fibonacci system level, the R1 daily Pivot Point level and the 23.6% weekly Fibonacci system level all converge.
If it were to soar higher and overcome this resistance, it is not to the $6,640 price level that it would again meet an important confluence that could impede its progress. This level contains last week’s low, the daily Pivot Point R2 level and the middle rail of a standard Bollinger Band system.
Below the current price, Bitcoin enjoys strong support up to the $6,300price level. This strong confluence that supports the BTC/USD is composed of, among others, the monthly S1 level of Pivot Point, the weekly and daily 38.2% level of the Fibonacci system and the simple average of ten periods in daily terms.
Below this confluence level, there is significant support at the $6,180price level, consisting of the 61.8% weekly Fibonacci system level and the S1 daily Pivot Point level.
ETH/USD 240
The ETH/USD is not as protected as the BTC/USD and remains equidistant from support and resistance levels.
Above the current price, the first difficulties are between the price level of $277 and $285. This resistance is formed, among other indicators, by the 23.6% level of the Fibonacci system, the minimum of the last four hours or the 38.2% weekly level of the Fibonacci system.
If the ETH/USD could overcome this resistance zone, it would not be worth the effort as $290 is close by and is resistance as well. The ETH/USD would encounter resistance since the simple moving average of 200 periods in the range of one and four hours and the 61.8% daily level of the Fibonacci calculation system would be waiting for them there.
Below the current price, there is very little that can serve as a minimum support if sales of some importance appear. The price level of $270includes the weekly S1 Fibonacci system, the daily low and the 23.65% Fibonacci system. Below that level, hardly any support.
XRP 240 Min
Ripple is already used to complicate his life for himself and that’s what it’s going to do today too. It is located under a broad support structure with a starting level of $0.3256 and ending at a price level of $0.3408. Among other indicators, this confluence includes the 38.2% weekly level of the Fibonacci system, the 38.2% daily level of the same mathematical system and multiple moving averages.
Below the current price, the analysis will be quick because of the shortage. At the price level of $0.3226 is located the 23.6% level of the Fibonacci retracement system as the main indicator, while the next support is located at $0.3120. In this last price level is located the yesterday low´s, the 1H SMA200 or the 4H Exponential Average of 50 periods.