
Latest Litecoin News
Inspired by events leading up to crypto rally fever pitch of Dec 2017, the Litecoin development team plan to implement Litecoin core 0.17 where network fees will be slashed by a factor of 10. During the great bull run of Q3 2017, it was not unusual for the network users to pay high fees which at one point peaked at $1.
Theoretically, network fees should be set by market participants and at the moment the cost manually set at 0.001LTC/kb but this intervention by the development team is some sort of a plan to counter check odds of network fee hikes once adoption increases and Litecoin uses spikes.
In a network without proper mitigation, congestion will lead to high fees as miners become selective, accepting high fees from those who prefer fast transaction settlement.
At the same time, Litecoin plan to drop fees to stay competitive as a medium of exchange as they anticipate the market to bottom up. The moment prices pick up, the foundation will have a strong foundation for a fee rate “which they can proactively grow” with.
LTC/USD Litecoin Price Analysis
From coin trackers, Litecoin is down 2.5 percent in the last week and flat in the daily chart.
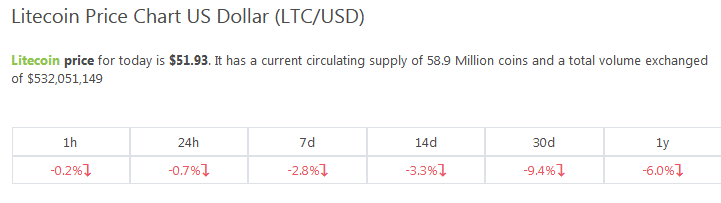
Overly, there is nothing much we can draw from LTC/USD price chart because of inactivity. Prices are literally ranging inside a $5 with caps at $55 and main support at $50.
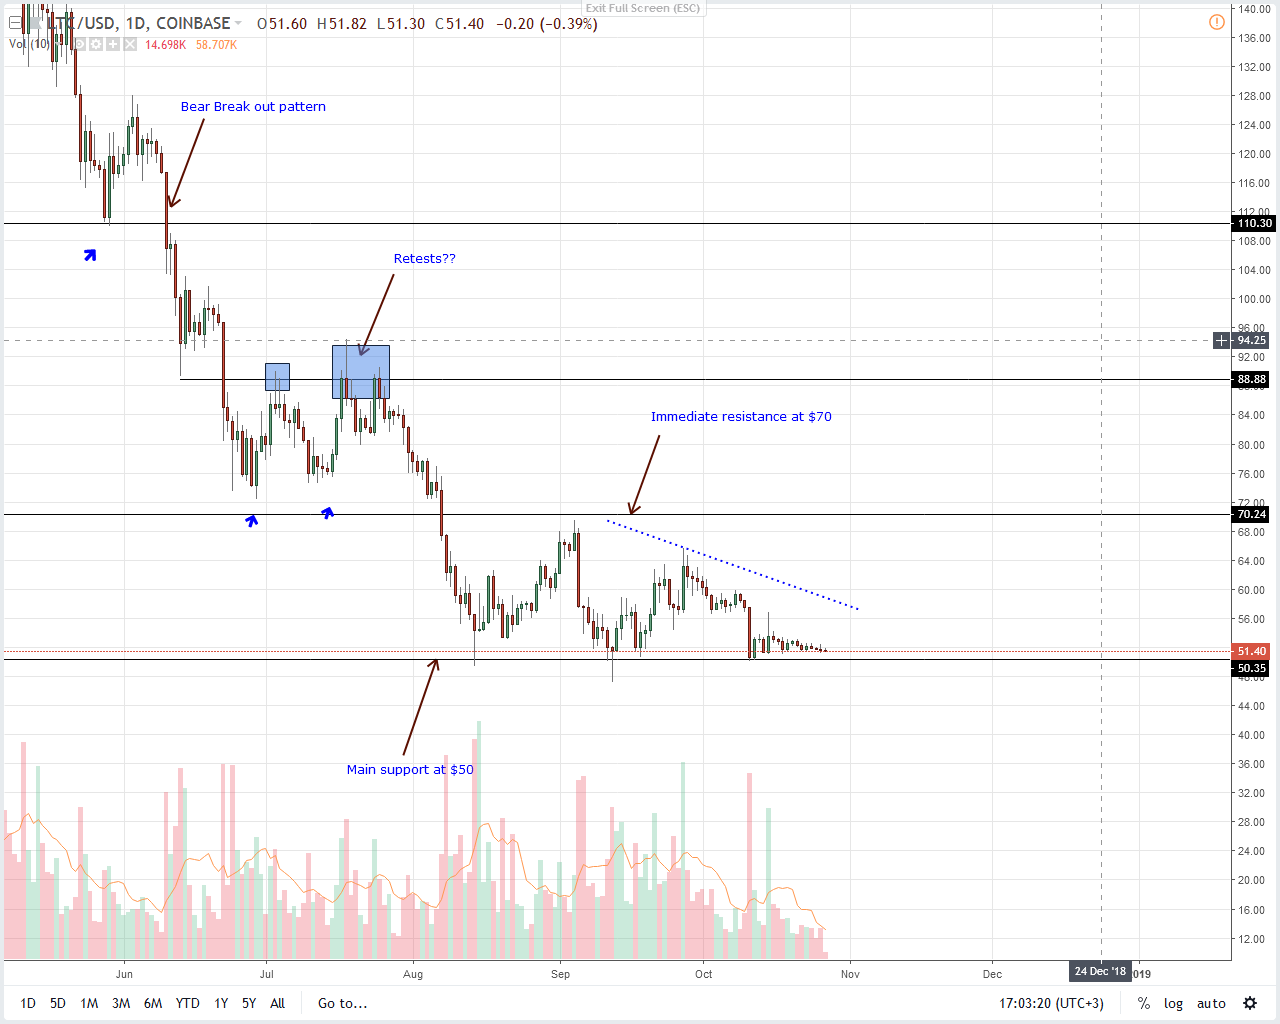
Trend: Bearish
A simple trend line connecting monthly highs reveals what is obvious: Litecoin is struggling against bears. But even if the market is optimistic of gains, it’s a tall order for bulls because not only do they need to reverse Oct 11 loses but they also need to break and close the main resistance line at $70. From the chart, $70 is an important resistance, previous support line marking the bear break down pattern of early Aug. On the other hand, bears will likely confirm their presence if there is a meltdown below $50. For this to be true we need to see a whole high volume bear candlestick closing below $50.
Volumes: High Bear Volumes—exceeds those of Oct 15 Bulls
Of concern is the relatively high market participation in Oct 11. While USDT outflow triggered high market participation on Oct 15, volumes were lower. Notably, bulls didn’t muster enough momentum to reverse Oct 11 losses meaning bears are in control from an effort versus result point of view.
Candlestick Formation: Ranging Market
The LTC/USD chart was inactive because of a ranging market. As mentioned above, LTC/USD is moving inside a $5 range with minor caps at $55 and major support at $50. Like it has been the case, the longer the consolidation, the stronger the break out. After 10 months of lower lows, the market expect a revival but it could get worse there is confirmation of Oct 11 bears. Such a scenario will pave way for sellers aiming at $30—or lower.
Conclusion
Trading with sentiment will get you burnt. That’s why despite all the hype and expectations, a contrarian move might print out driving LTC/USD pair lower. Therefore, as the market consolidates above $50, we suggest taking a neutral approach and as we wait for trend defining break outs above $55–$60 or below $50.
Charts from Trading View