
Basic Attention Token (BAT) has seen a solid 8.67% price increase over the past 24 hours of trading. The cryptocurrency is currently exchanging hands at a price of $0.1715 after seeing a further 10.58% price increase over the past 7 trading days.
The Brave browser have continued to dominate the media after announcing a solid partnership and announcing that it had reached over 4 million active users after reaching 10 million google Play Store downloads.
Investors continue to wait as the Brave team roll out a live advertising trial for the browser. If Brave succeed in their vision, they will successfully create a global advertising platform.
BAT is currently ranked at 44th position in terms of overall market cap rankings across the entire industry. It has a total market cap value of $171 million after suffering a 37% price decline over the past 90 trading days. BAT is still trading at a price that is 80% lower than its all time high price.
Let us continue to analyse price action over the short term and update our potential support and resistance areas.
Price Analysis
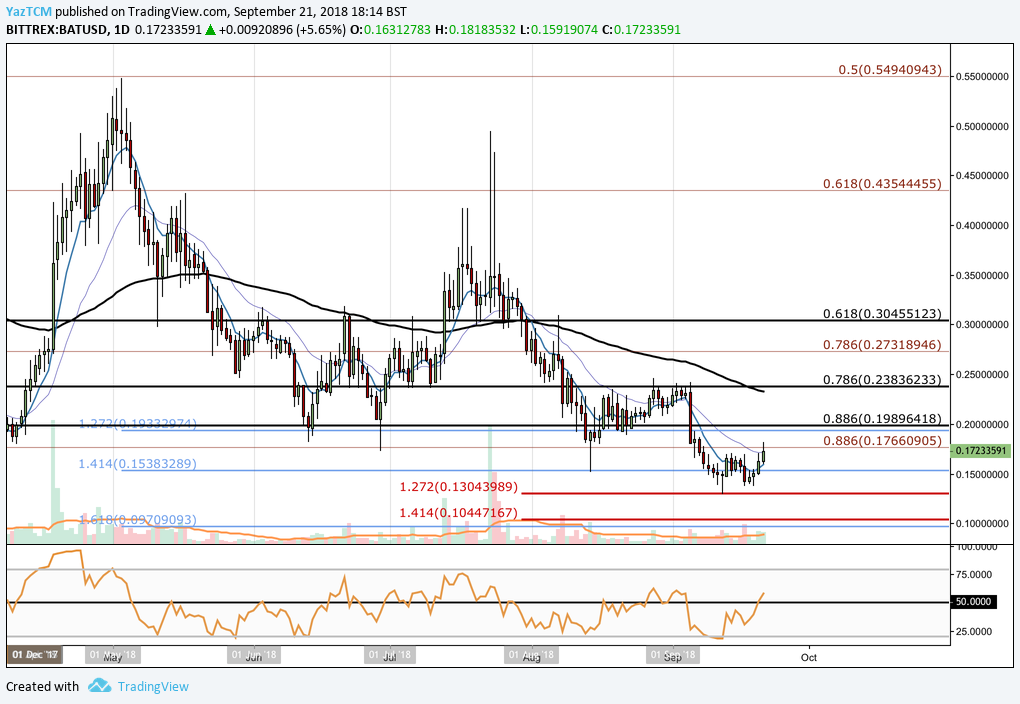
Analysing the market from the short term perspective above we can see that price action has fallen through all of our previous expected support levels during September 2018.
As the bloodbath of trading began in September 2018, price action tumbled until it found support at a short term downside 1.272 FIbonacci Extension level (drawn in red) priced at $0.1538. We can also notice that our previously highlighted downside 1.414 Fibonacci Extension level (drawn in blue) priced at $0.1538 did provide a decent level of support during this time period.
The market has since rebounded and is now trading at resistance highlighted by the long term .886 FIbonacci Retracement level priced at $0.1766 where the momentum has stalled slightly.
Moving ahead, if the bullish price action can continue and push the market above the resistance at $0.1788 then immediate resistance higher can be expected at the short term .886 Fibonacci Retracement level (drawn in black) priced at $0.1989. Further resistance above this can then be expected at the short term .786 Fibonacci Retracement level (drawn in black) priced at $0.2382. This area of resistance will require significant momentum to overcome due to the 100 day moving average being closely located within this area.
If price action continue above the 100 day moving average, further resistance can then be expected at the long term .786 Fibonacci Retracement level (drawn in red) priced at $0.2731 followed by the short term .618 Fibonacci Retracement level (drawn i black) priced at $0.3045.
Alternatively, any negative pressure is expected to be immediately absorbed by the downside 1.414 Fibonacci Extension level (drawn in blue) priced at $0.1538. Support located beneath this support level can be found at the short term downside 1.272 Fibonacci Extension level (drawn in red) priced at $0.1304.
The technical indicators within the market have recently swing into the favour of the bulls. The RSI has broken up above the 50 handle indicating that the bulls are now in control of the momentum within the market. If the bulls can stay above the 50 handle we can expect the bullish momentum to continue.